The other day I was putting together an analysis on sales performance across product categories and individual SKUs, but I was having trouble communicating that even our smallest product in one category was larger than an entire, different category.
I messed around in PowerPoint with two bar charts next to each other on a slide, or different levels of detail on different slides, but couldn't quite communicate the story I wanted to tell.
Mosaic or Mekko Charts: Eh.
After a lot of futzing, I took a step back and thought about if there was a better way to visualize the data. Initially I thought about a Mosaic (also called Marimekko or Mekko) chart.
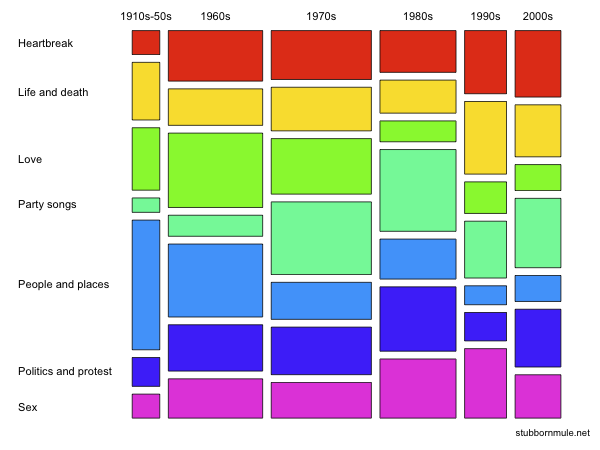
By Seancarmody - Own work, CC BY-SA 3.0, https://commons.wikimedia.org/w/index.php?curid=7389833
There are two main problems with these charts, though. First, people aren't very good at comparing areas. Second, they aren't super intuitive for non-data nerd people.
Nested Bar Charts
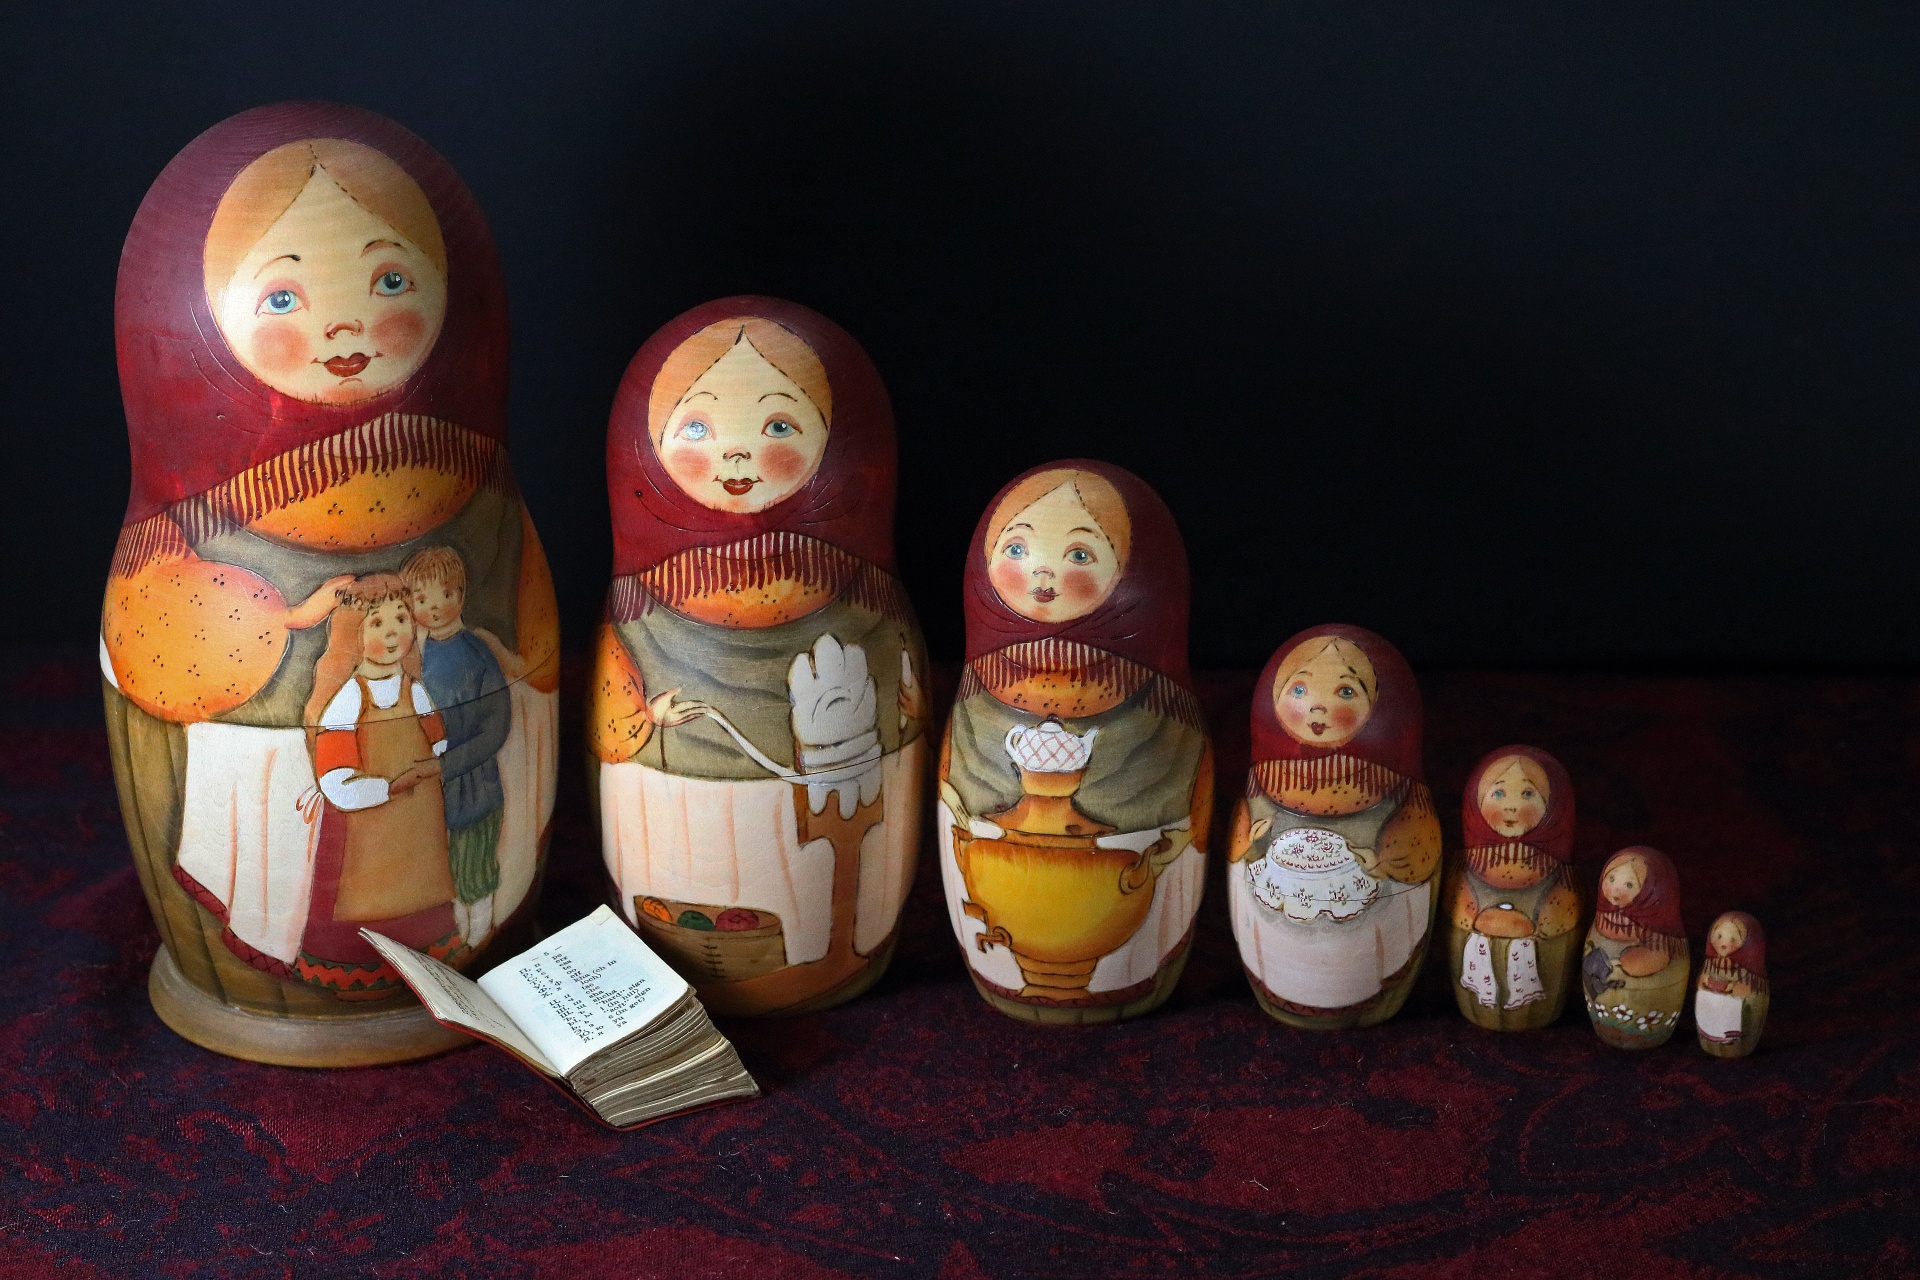
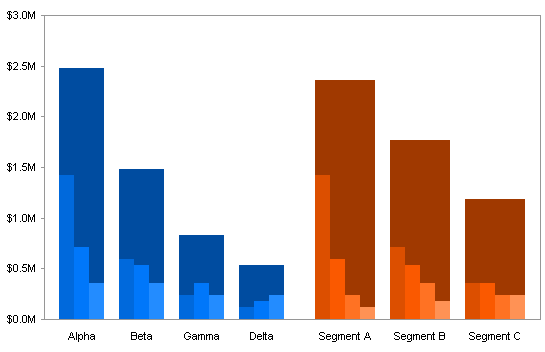
I don't remember where I first read about nested bar charts, but it seemed like the perfect solution for this specific problem.
A nested bar chart is really two bar charts displayed in one layer. In the background is the heights demonstrating the larger category's value, while on top of that is each item's value that makes up the larger category.
By John Peltier https://peltiertech.com/marimekko-replacement-2-by-2-panel/
A Scaffolding Function
I did a quick search and didn't see any R packages to create them in ggplot2, so I threw together a function that would take any dataset, group it by a large grouping and a smaller grouping and print out the ggplot2 code needed to create a nested bar chart.
The reason I printed out the code instead of the chart itself is to avoid the complexity and tweaking that each nested bar chart needs, such as label prefixes, colors, labels, etc.
library(tidyverse)
library(glue)
library(cli)
library(datasets)
nestedBarChart <- function(data, bigGroup, smallGroup, measure, calculation = "sum") {
if(!calculation %in% c("sum", "count")) {cli::cli_abort("Calculation must be either 'sum' or 'count'")}

colNameString <- ensym(bigGroup)
measureString <- ensym(measure)
colName1 <- paste0(as.character(colNameString), "Summary")
colName2 <- paste0(colName1, "Label")
dataName <- ensym(data)

if(calculation == "sum") {

    out <-
        glue("
        <<<dataName>>> |>
            group_by(
                <<<ensym(bigGroup)>>>,
                <<<ensym(smallGroup)>>>
                ) |>
            summarize(<<<ensym(measure)>>> = sum(<<<ensym(measure)>>>, na.rm = TRUE)) |>
            ungroup() |>
            mutate(<<<colName1>>> := sum(<<<measureString>>>), .by = <<<ensym(bigGroup)>>>) |>
            mutate(<<<colName2>>> := ifelse(<<<measureString>>> == min(<<<measureString>>>), sum(<<<measureString>>>), NA), .by = <<<ensym(bigGroup)>>>) |>
            mutate(centerCount := (n_distinct(<<<ensym(smallGroup)>>>) + 1) / 2, .by = <<<ensym(bigGroup)>>>) |>
            ggplot() +
            geom_bar(aes(x = fct_reorder(<<<ensym(smallGroup)>>>, <<<measureString>>>), y = <<<measureString>>>), stat = 'identity') +
            geom_text(aes(x = fct_reorder(<<<ensym(smallGroup)>>>, <<<measureString>>>), y = <<<measureString>>>, label = <<<measureString>>>), stat = 'identity', vjust = -0.9) +
            geom_bar(aes(x = fct_reorder(<<<ensym(smallGroup)>>>, <<<measureString>>>), y = <<<colName1>>>), stat = 'identity', alpha = 0.1, width = 1) +
            geom_text(aes(x = centerCount, y = <<<colName1>>>, label = <<<colName2>>>), stat = 'identity', vjust = -0.9) +
            facet_wrap(facets = vars(fct_reorder(<<<ensym(bigGroup)>>>, <<<measureString>>>)), scales = 'free_x') +
            scale_y_continuous(limits = c(0, NA), expand = expansion(mult = c(0, 0.1)))
        ", .open = "<<<", .close = ">>>", .literal = TRUE)

} else if (calculation == "count") {

    out <-
        glue("
        <<<dataName>>> |>
            group_by(
                <<<ensym(bigGroup)>>>,
                <<<ensym(smallGroup)>>>
                ) |>
            summarize(<<<ensym(measure)>>> = n()) |>
            ungroup() |>
            mutate(<<<colName1>>> := sum(<<<measureString>>>), .by = <<<ensym(bigGroup)>>>) |>
            mutate(<<<colName2>>> := ifelse(<<<measureString>>> == min(<<<measureString>>>), sum(<<<measureString>>>), NA), .by = <<<ensym(bigGroup)>>>) |>
            mutate(centerCount := (n_distinct(<<<ensym(smallGroup)>>>) + 1) / 2, .by = <<<ensym(bigGroup)>>>) |>
            ggplot() +
            geom_bar(aes(x = fct_reorder(<<<ensym(smallGroup)>>>, <<<measureString>>>), y = <<<measureString>>>), stat = 'identity') +
            geom_text(aes(x = fct_reorder(<<<ensym(smallGroup)>>>, <<<measureString>>>), y = <<<measureString>>>, label = <<<measureString>>>), stat = 'identity', vjust = -0.9) +
            geom_bar(aes(x = fct_reorder(<<<ensym(smallGroup)>>>, <<<measureString>>>), y = <<<colName1>>>), stat = 'identity', alpha = 0.1, width = 1) +
            geom_text(aes(x = centerCount, y = <<<colName1>>>, label = <<<colName2>>>), stat = 'identity', vjust = -0.9) +
            facet_wrap(facets = vars(fct_reorder(<<<ensym(bigGroup)>>>, <<<measureString>>>)), scales = 'free_x') +
            scale_y_continuous(limits = c(0, NA), expand = expansion(mult = c(0, 0.1)))
        ", .open = "<<<", .close = ">>>", .literal = TRUE)

}

out
}
Example 1: Warpbreaks
The first dataset I used to demonstrate this function is the warpbreaks dataset from the datasets package.
"This data set gives the number of warp breaks per loom, where a loom corresponds to a fixed length of yarn."
Here is the input into my function:
warpbreaks |>
    nestedBarChart(bigGroup = wool, smallGroup = tension, measure = breaks)
That prints to the console:
warpbreaks |>
    group_by(
        wool,
        tension
        ) |>
    summarize(breaks = sum(breaks, na.rm = TRUE)) |>
    ungroup() |>
    mutate(woolSummary := sum(breaks), .by = wool) |>
    mutate(woolSummaryLabel := ifelse(breaks == min(breaks), sum(breaks), NA), .by = wool) |>
    mutate(centerCount := (n_distinct(tension) + 1) / 2, .by = wool) |>
    ggplot() +
    geom_bar(aes(x = fct_reorder(tension, breaks), y = breaks), stat = 'identity') +
    geom_text(aes(x = fct_reorder(tension, breaks), y = breaks, label = breaks), stat = 'identity', vjust = -0.9) +
    geom_bar(aes(x = fct_reorder(tension, breaks), y = woolSummary), stat = 'identity', alpha = 0.1, width = 1) +
    geom_text(aes(x = centerCount, y = woolSummary, label = woolSummaryLabel), stat = 'identity', vjust = -0.9) +
    facet_wrap(facets = vars(fct_reorder(wool, breaks)), scales = 'free_x') +
    scale_y_continuous(limits = c(0, NA), expand = expansion(mult = c(0, 0.1)))
If I run that code, I get this ggplot2 chart out:
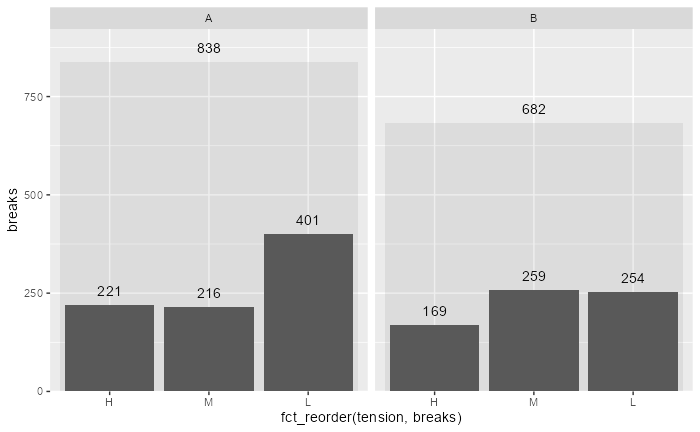
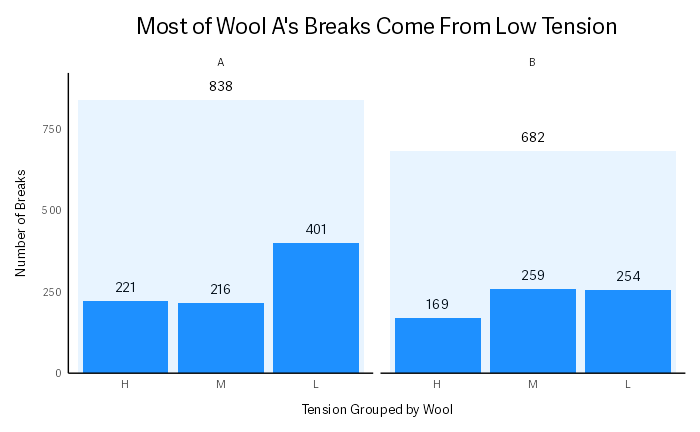
As you can see, it needs some care to get it to a publishable place, but most of the work is done for you.
You can now theme the chart, add labels, and size it appropriately.
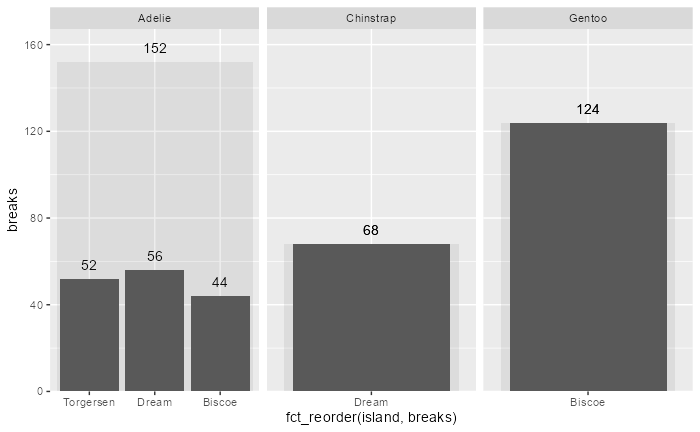
Example 2: Penguins
This example shows how I use my function when I am trying to summarize a count and also when each big group doesn't have the same number of smaller grouped items.
penguins |>
    nestedBarChart(bigGroup = species, smallGroup = island, measure = breaks, calculation = "count")
That gives me this output:
penguins |>
    group_by(
        species,
        island
        ) |>
    summarize(breaks = n()) |>
    ungroup() |>
    mutate(speciesSummary := sum(breaks), .by = species) |>
    mutate(speciesSummaryLabel := ifelse(breaks == min(breaks), sum(breaks), NA), .by = species) |>
    mutate(centerCount := (n_distinct(island) + 1) / 2, .by = species) |>
    ggplot() +
    geom_bar(aes(x = fct_reorder(island, breaks), y = breaks), stat = 'identity') +
    geom_text(aes(x = fct_reorder(island, breaks), y = breaks, label = breaks), stat = 'identity', vjust = -0.9) +
    geom_bar(aes(x = fct_reorder(island, breaks), y = speciesSummary), stat = 'identity', alpha = 0.1, width = 1) +
    geom_text(aes(x = centerCount, y = speciesSummary, label = speciesSummaryLabel), stat = 'identity', vjust = -0.9) +
    facet_wrap(facets = vars(fct_reorder(species, breaks)), scales = 'free_x') +
    scale_y_continuous(limits = c(0, NA), expand = expansion(mult = c(0, 0.1)))
Which in turn gives me this chart: